Attendance module update
Today, we're really pleased to be able to take the wraps off a major update to the Attendance module. Inspired by many of the suggestions our customers have made, we believe these updates add polish and additional functionality, as well as setting things up for future updates that we'd like to make. Here's Gavin talking about the changes and how to get started with the new features:
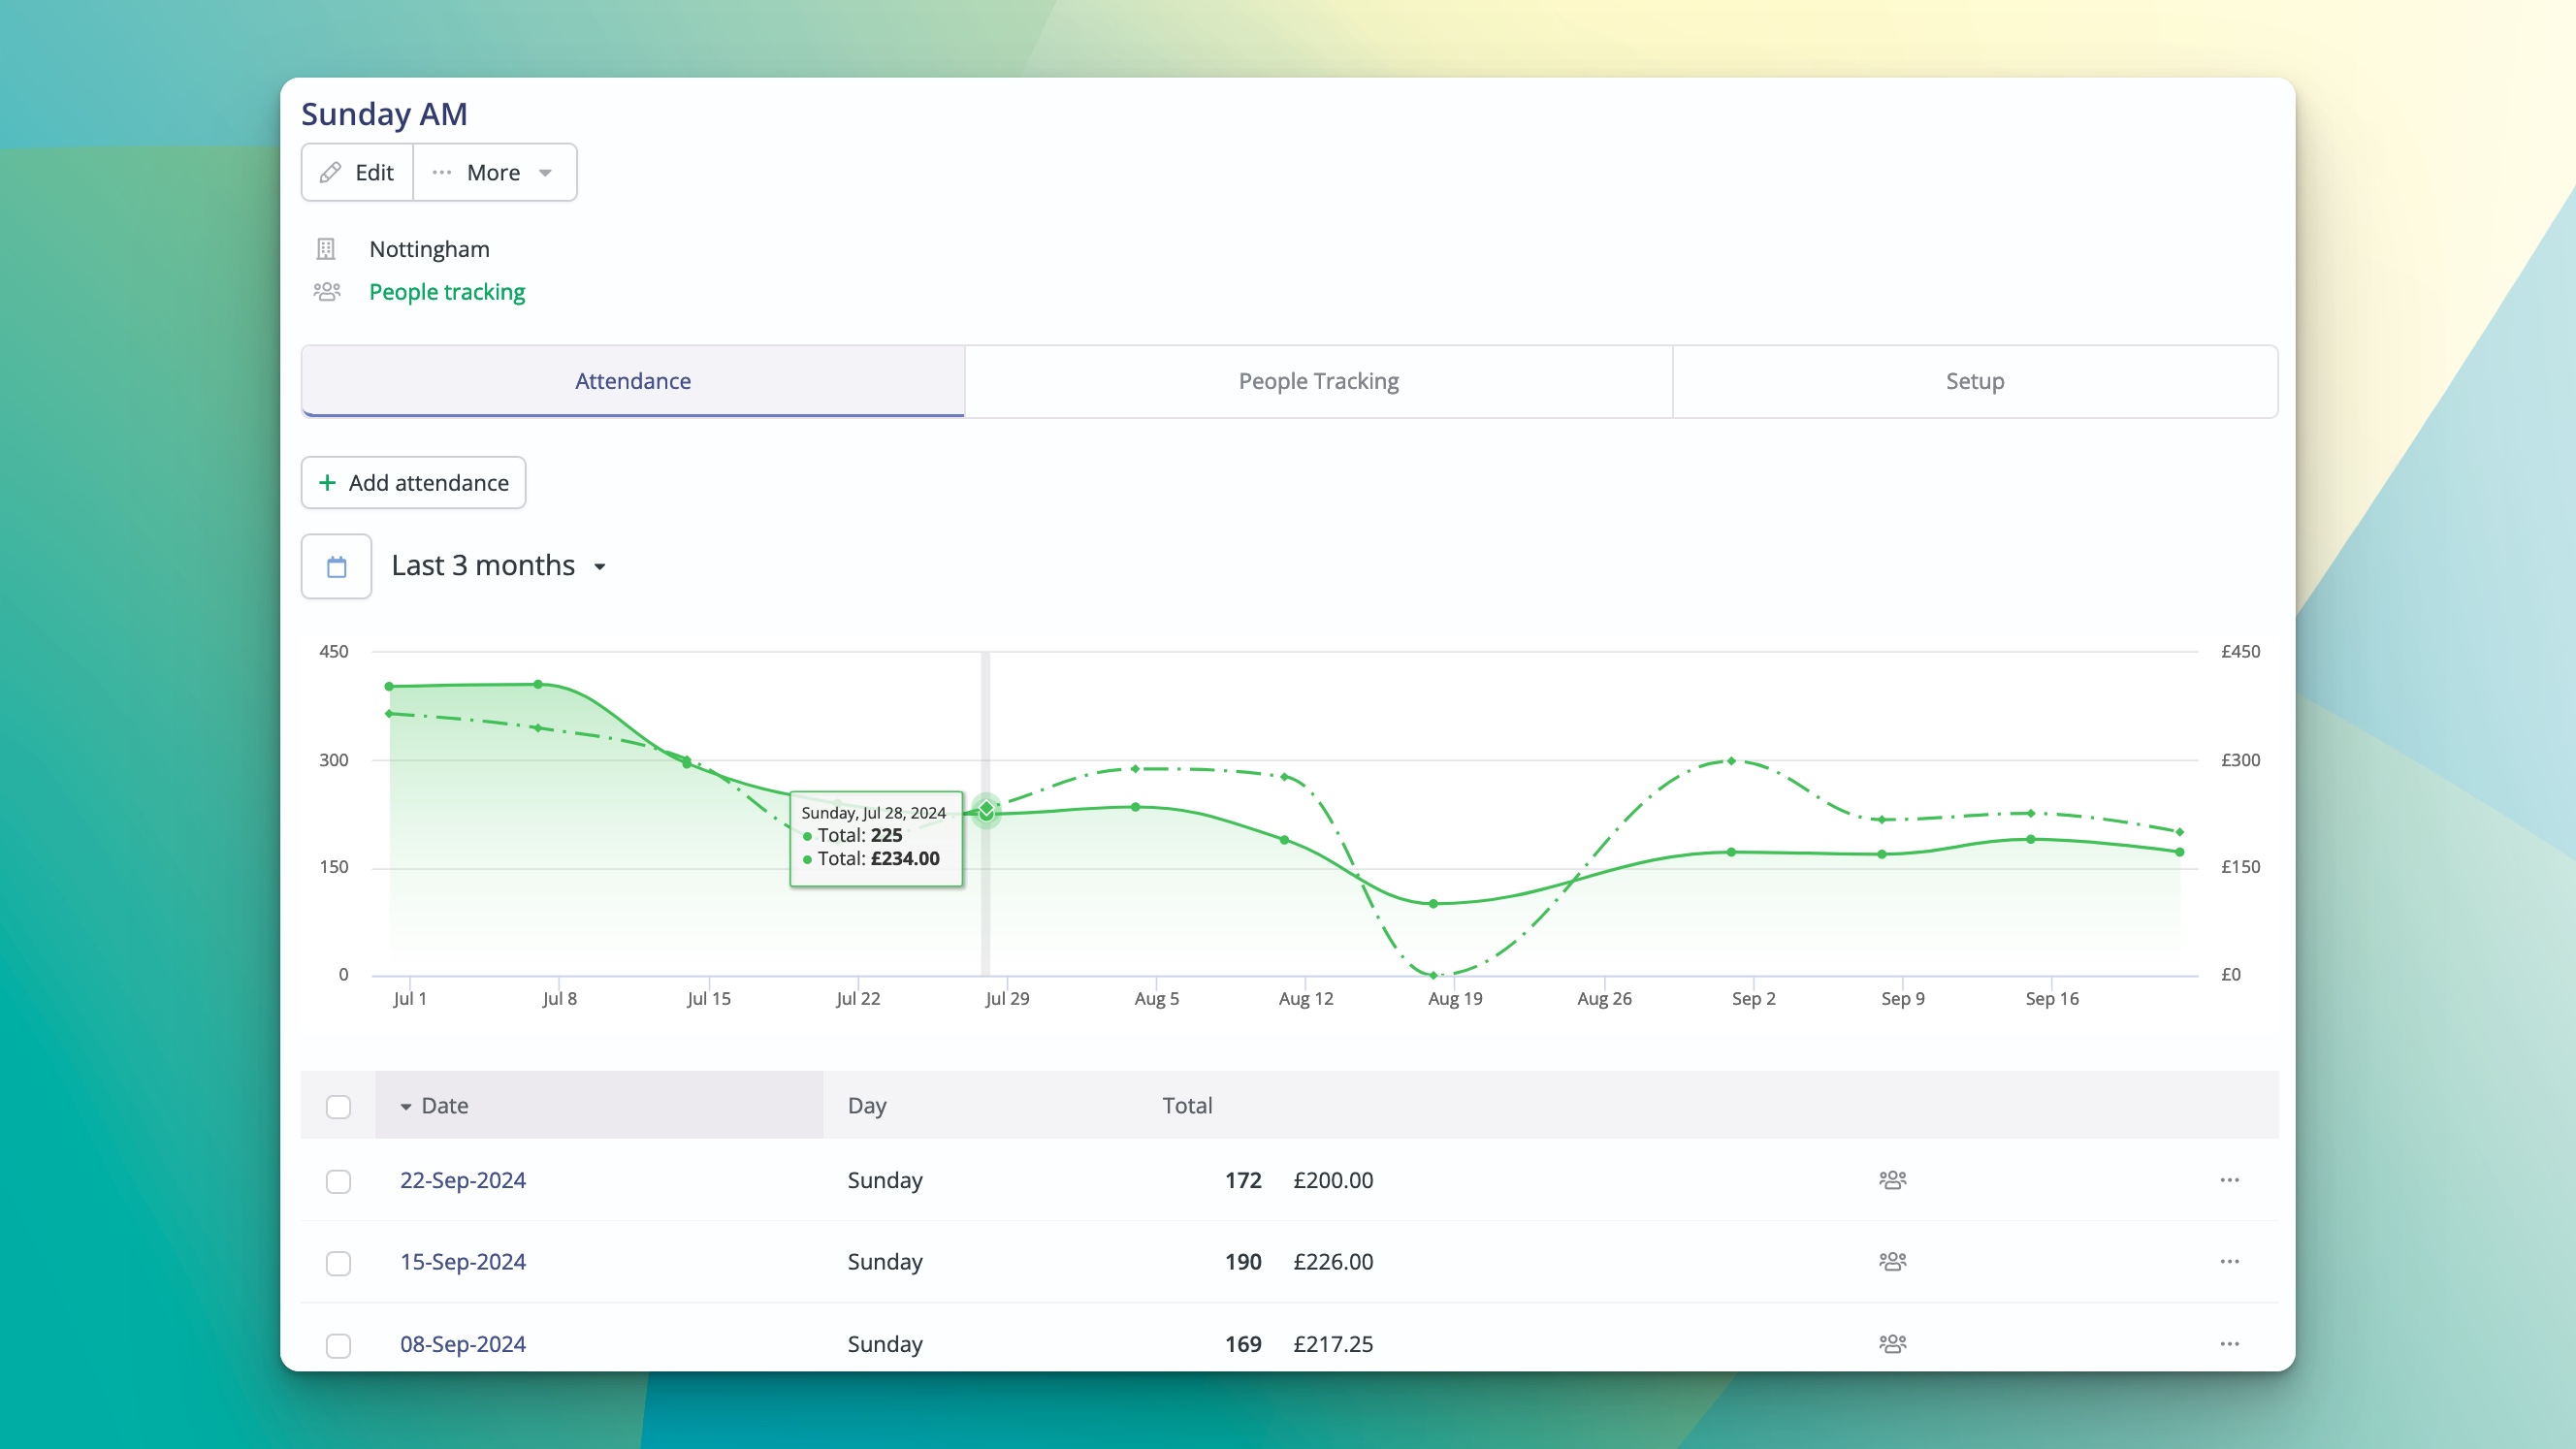
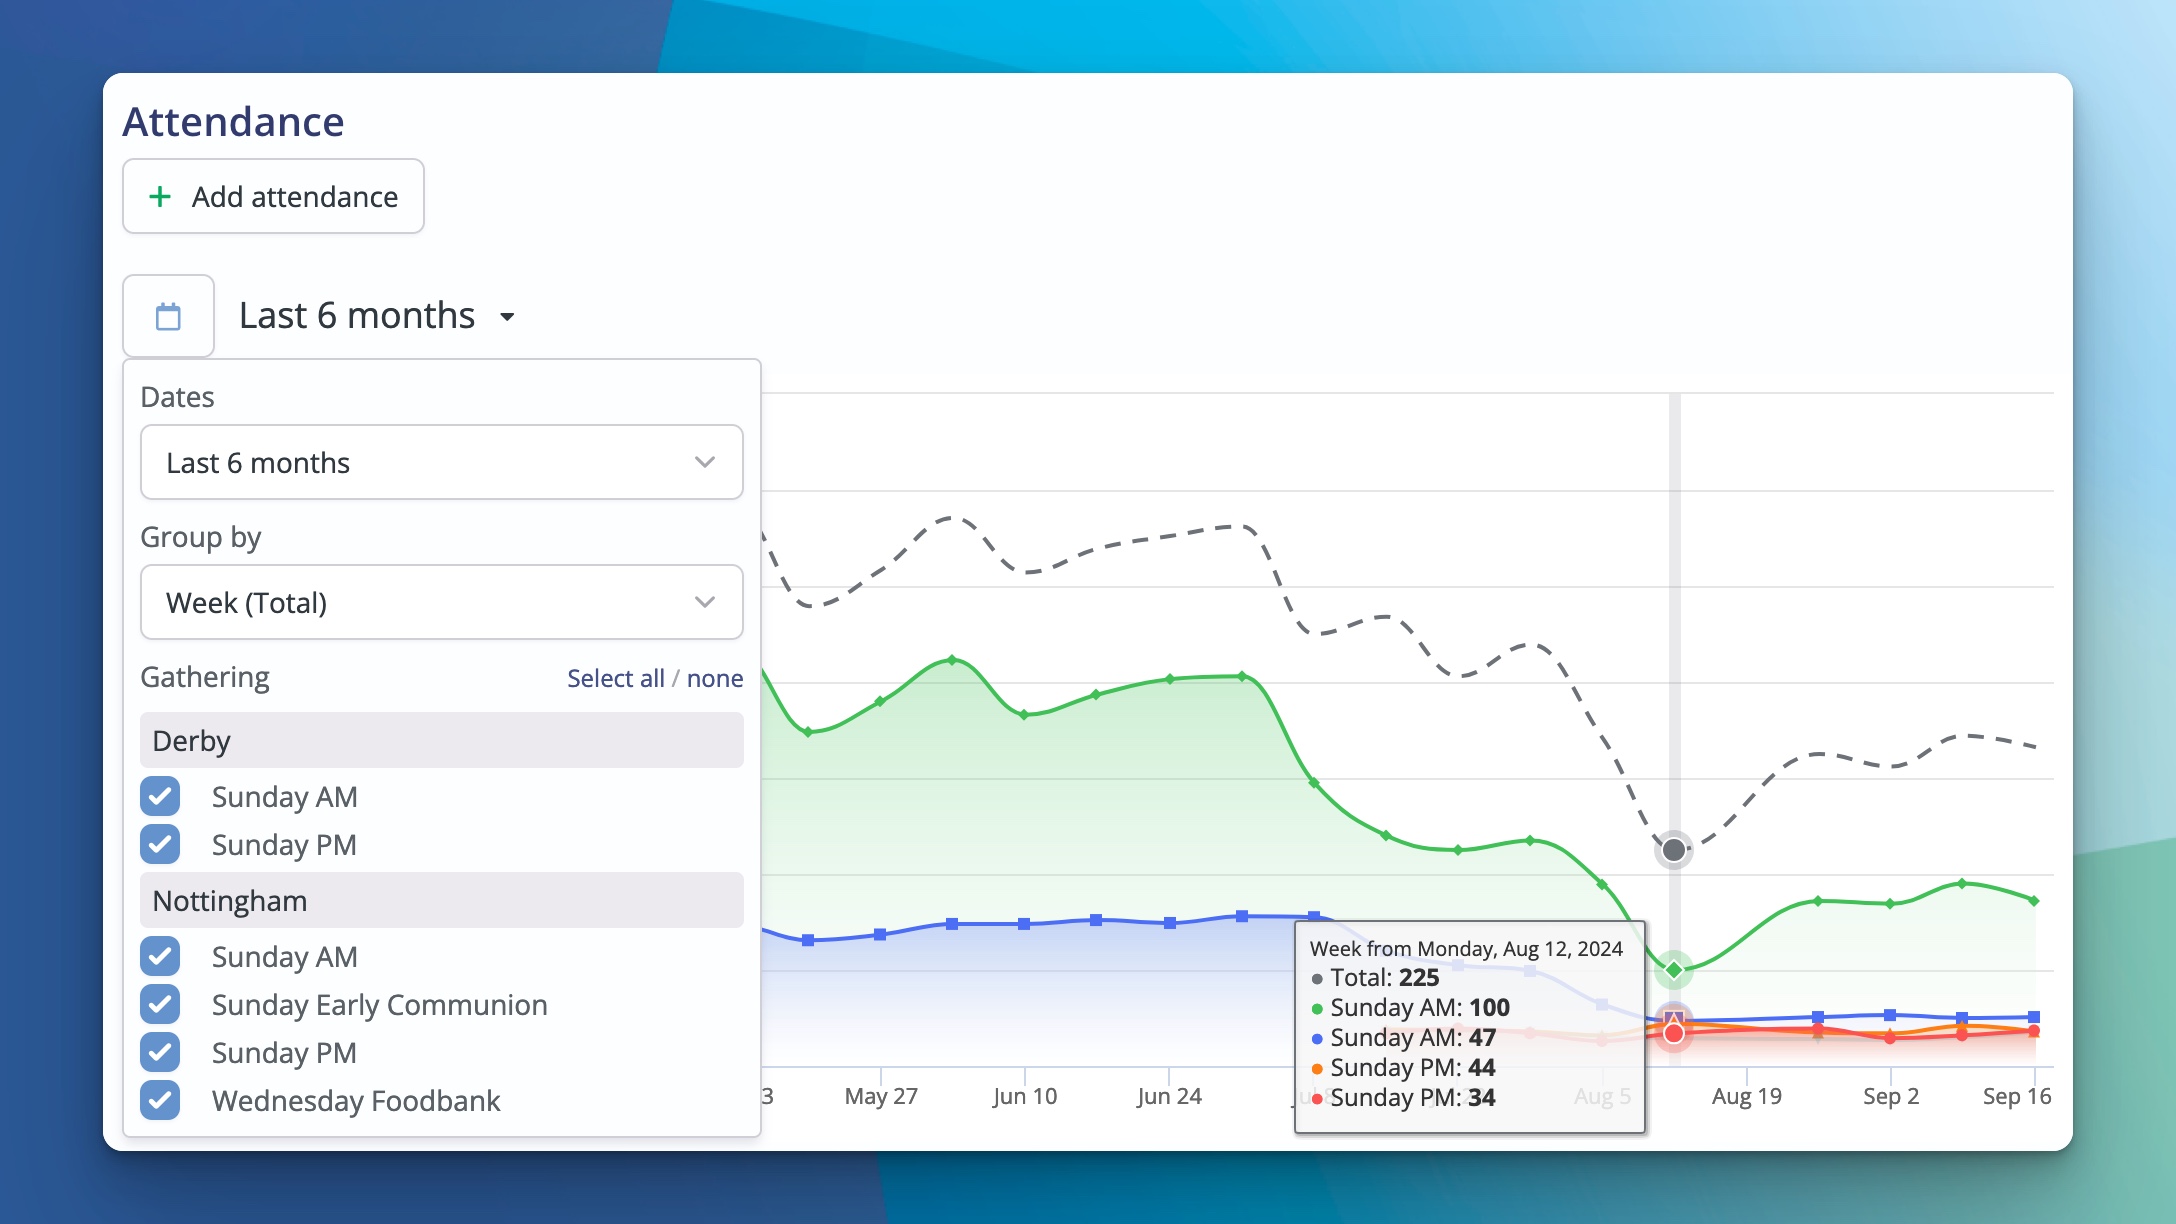
New interactive charts
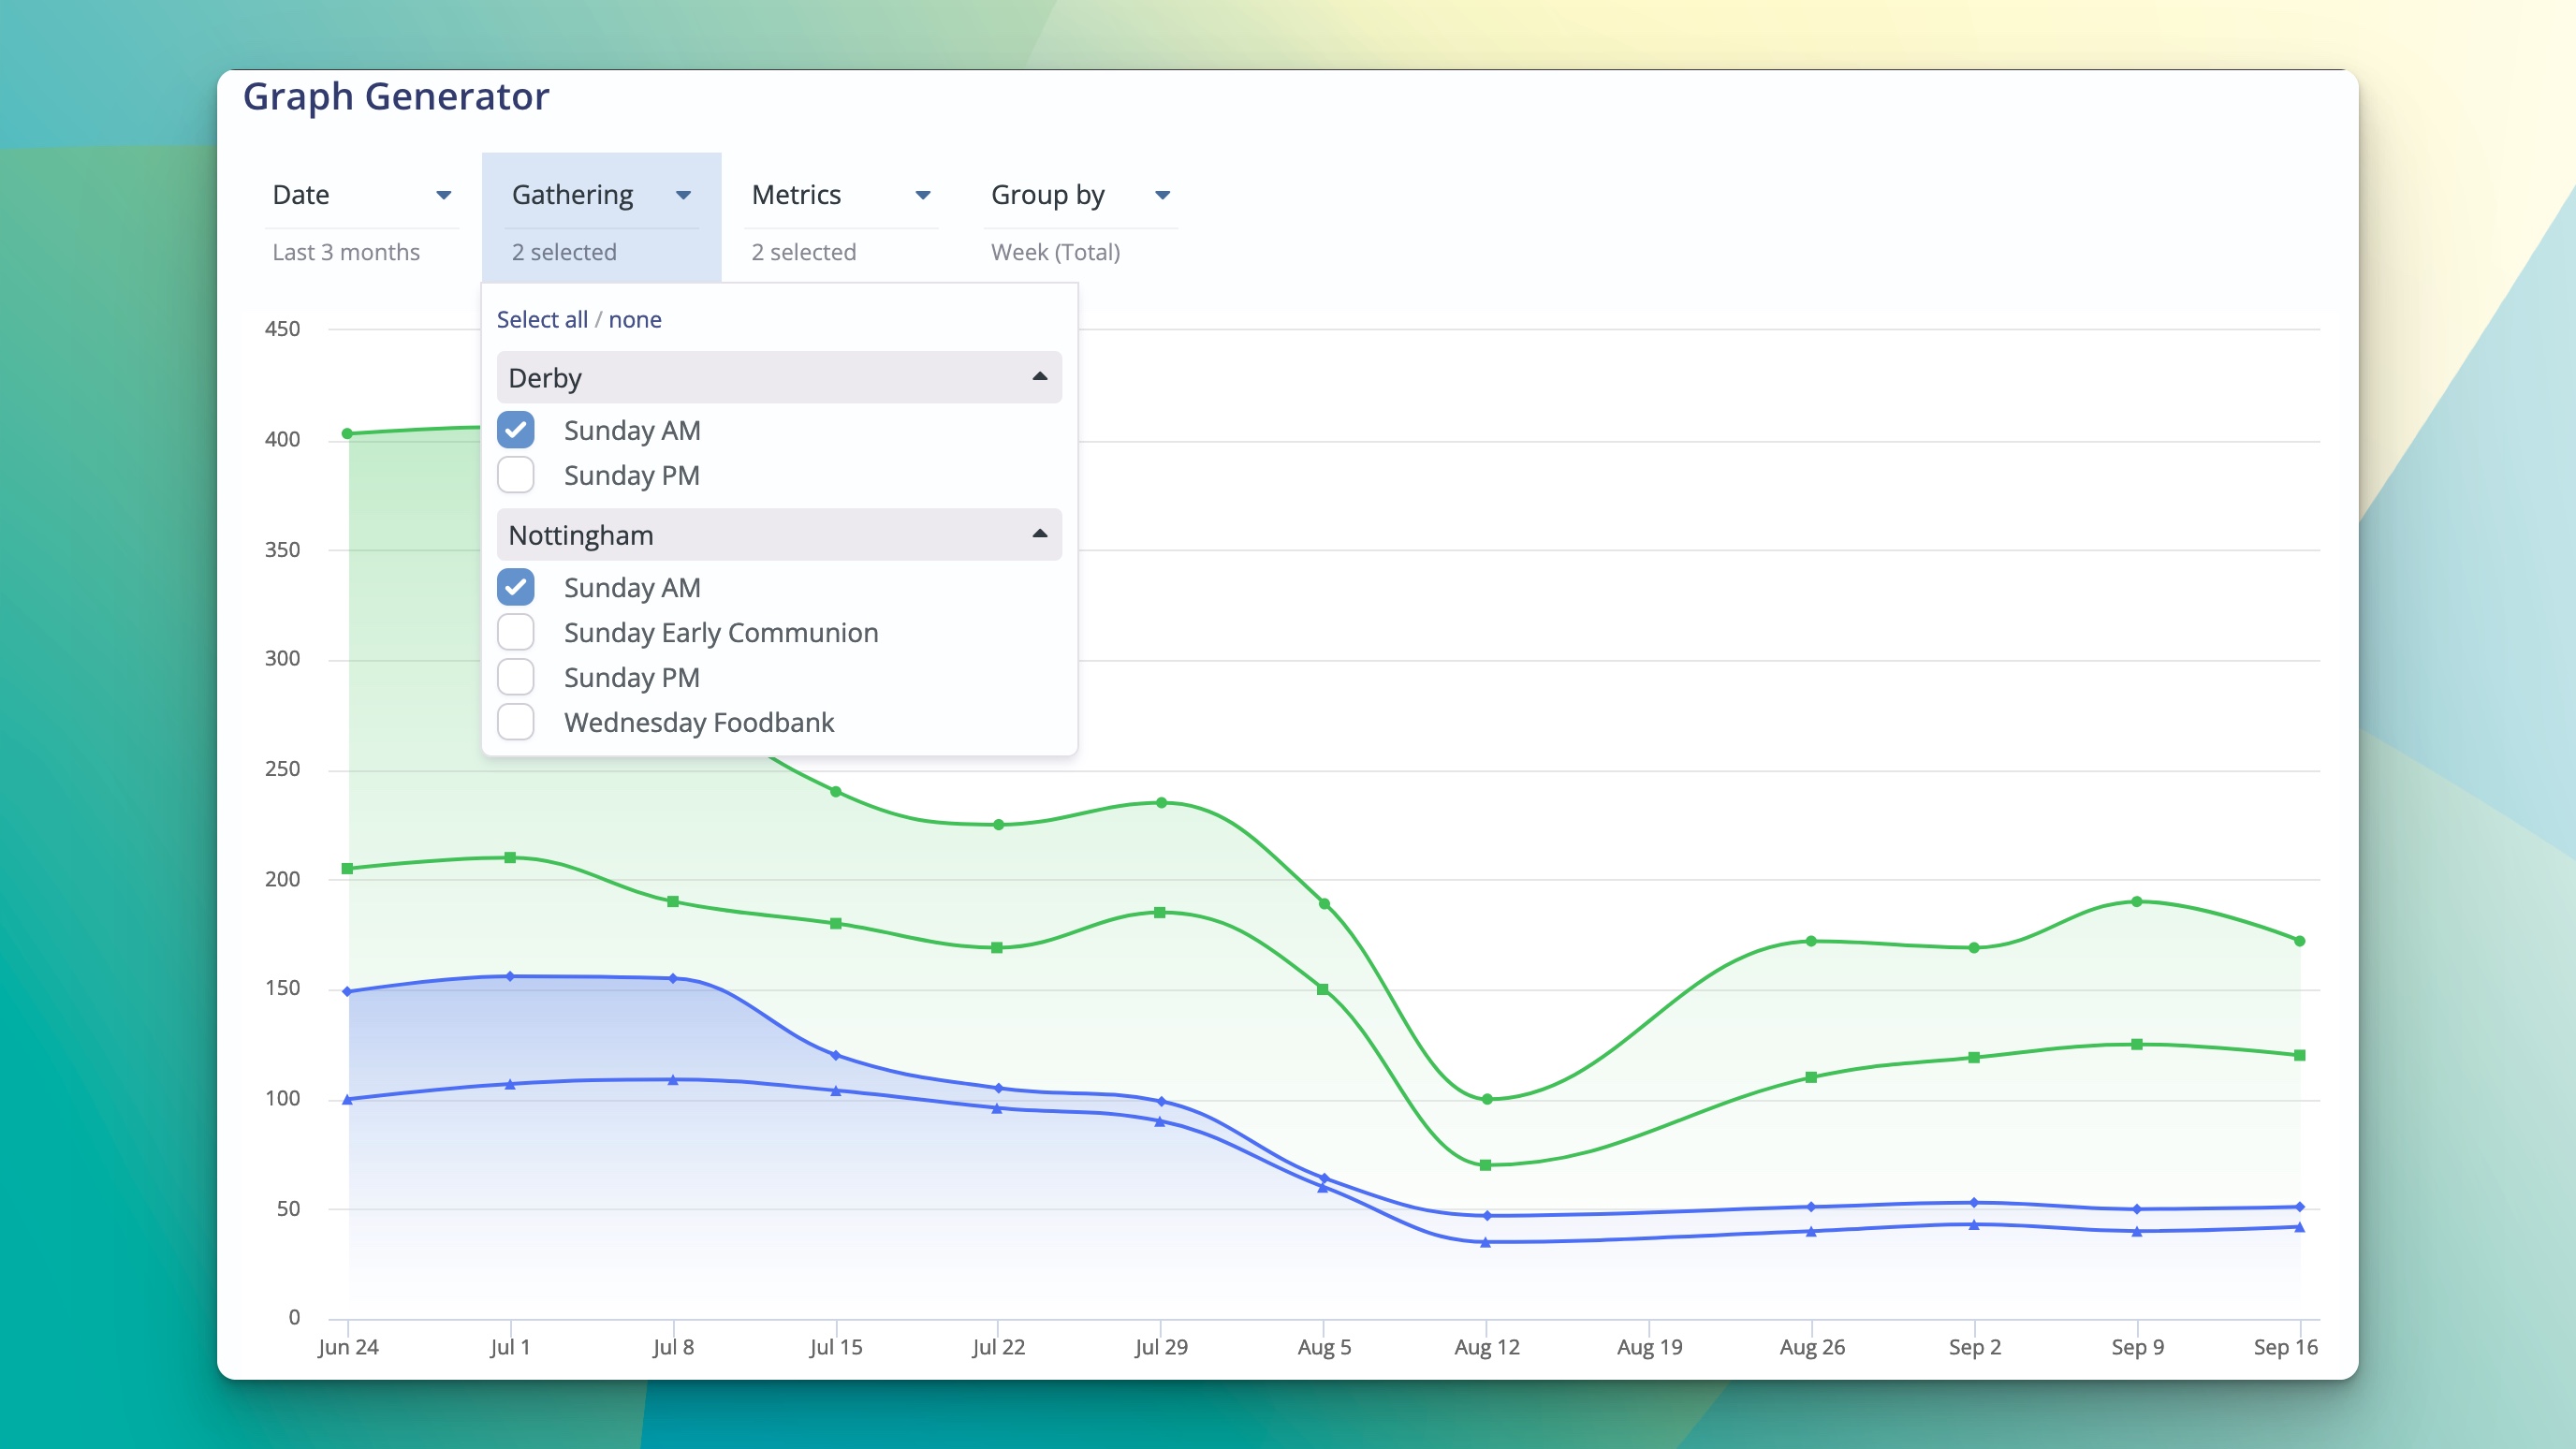
Not only do the new charts look good, but we've added a new level of interactivity that lets you really drill down into the data in a meaningful way. You can choose which gatherings you want to see on the chart as well as how you want the data to be displayed.
New Gatherings section
Attendance categories were previously grouped together, but we've now made it possible to separate these metricsets by gathering. For instance, if you have a morning service, an evening service, as well as a separate midweek gathering, all three of these gatherings can now have separate metricsets for you to track, adding a lot of flexibility.
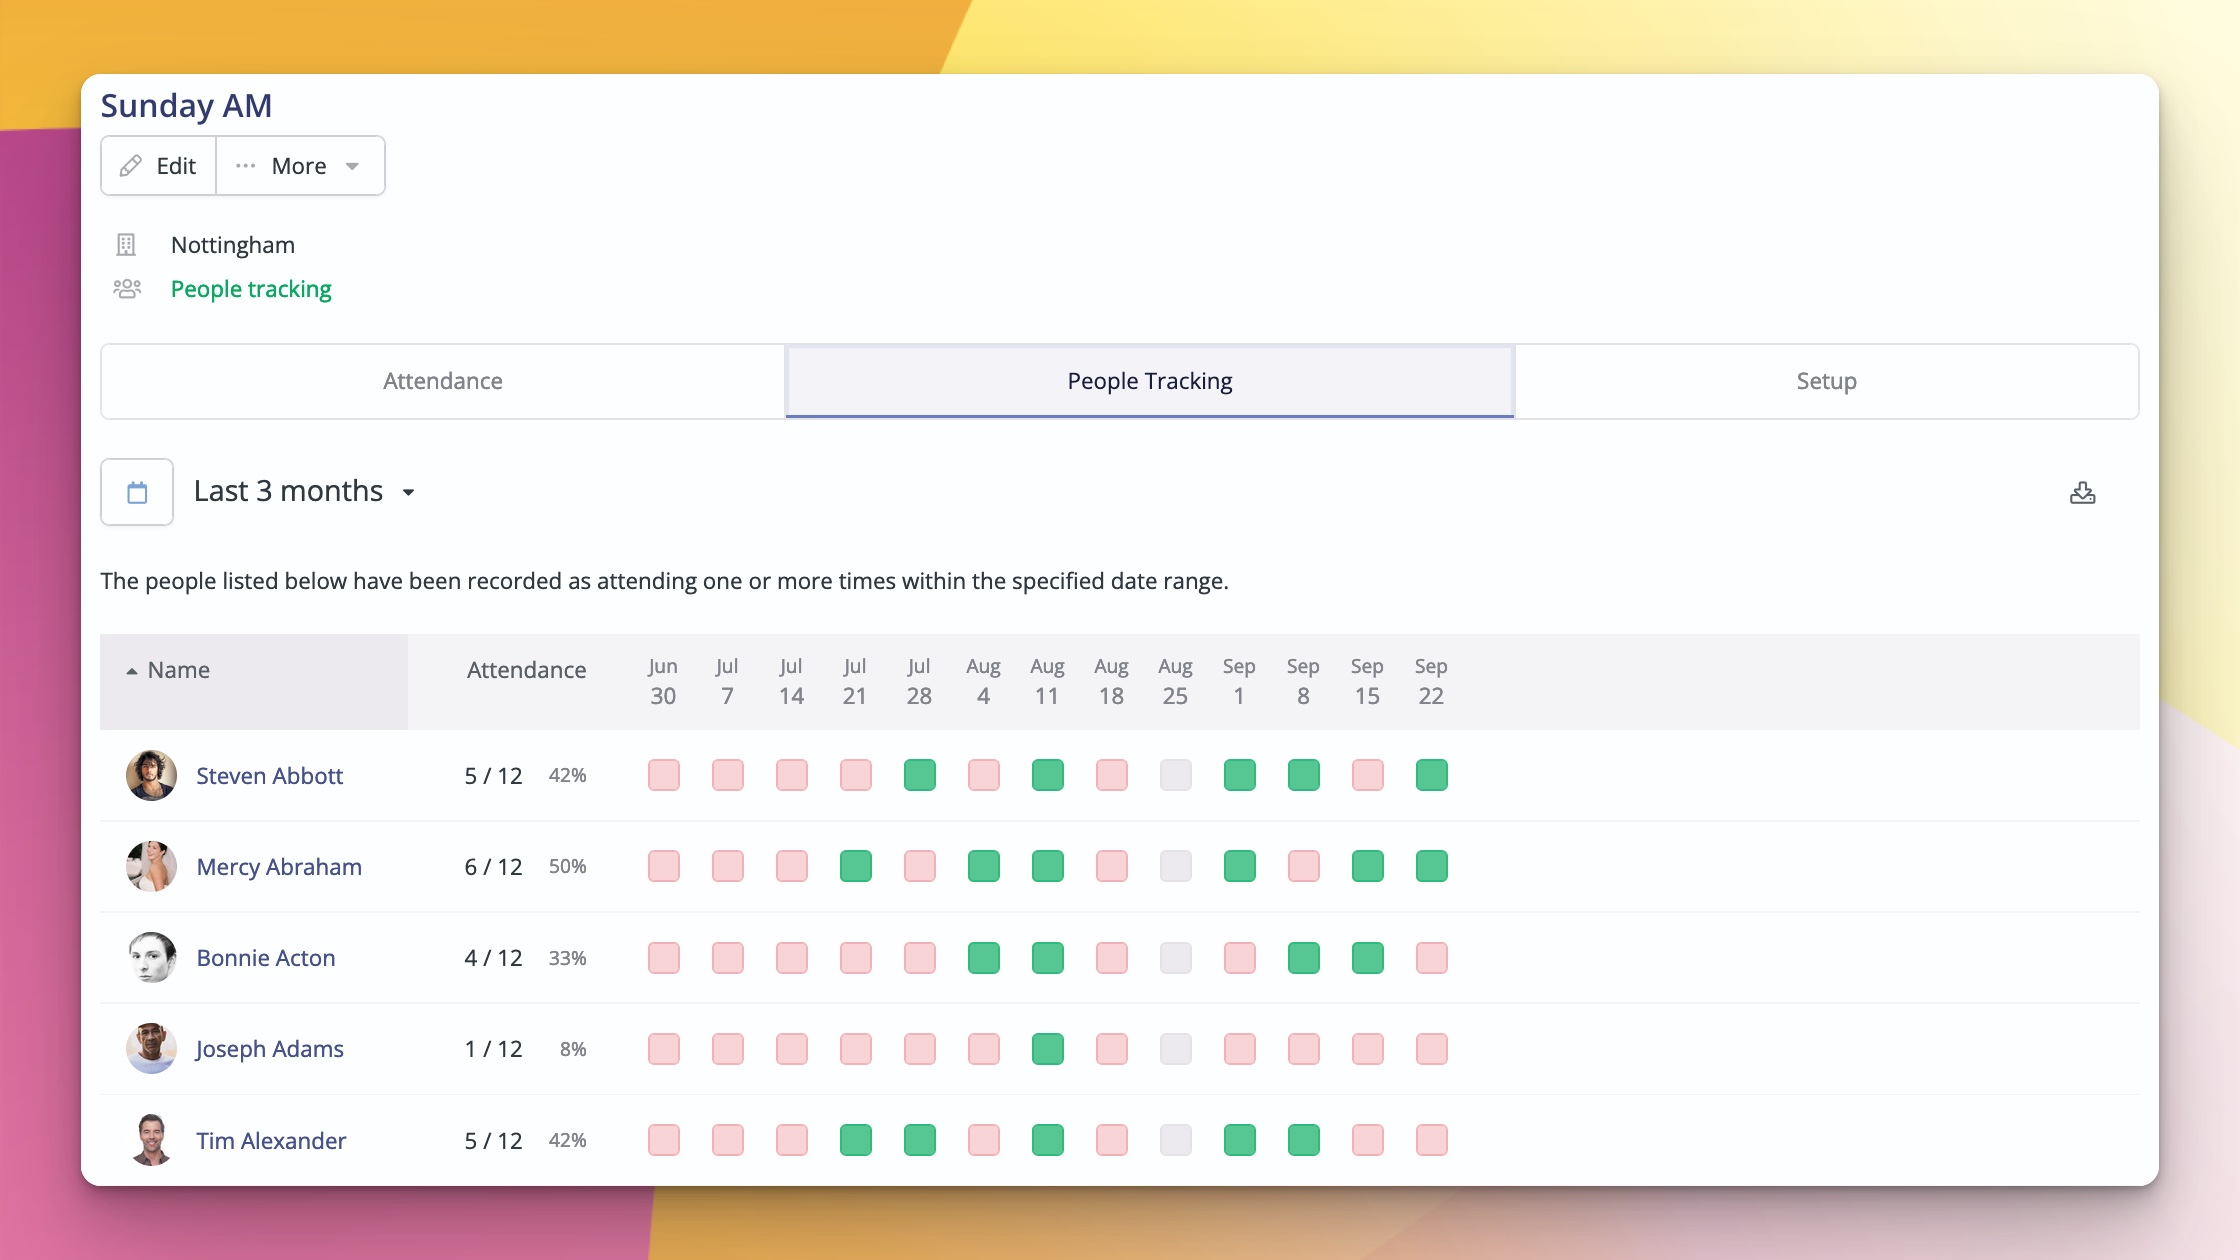
Updated People tracking
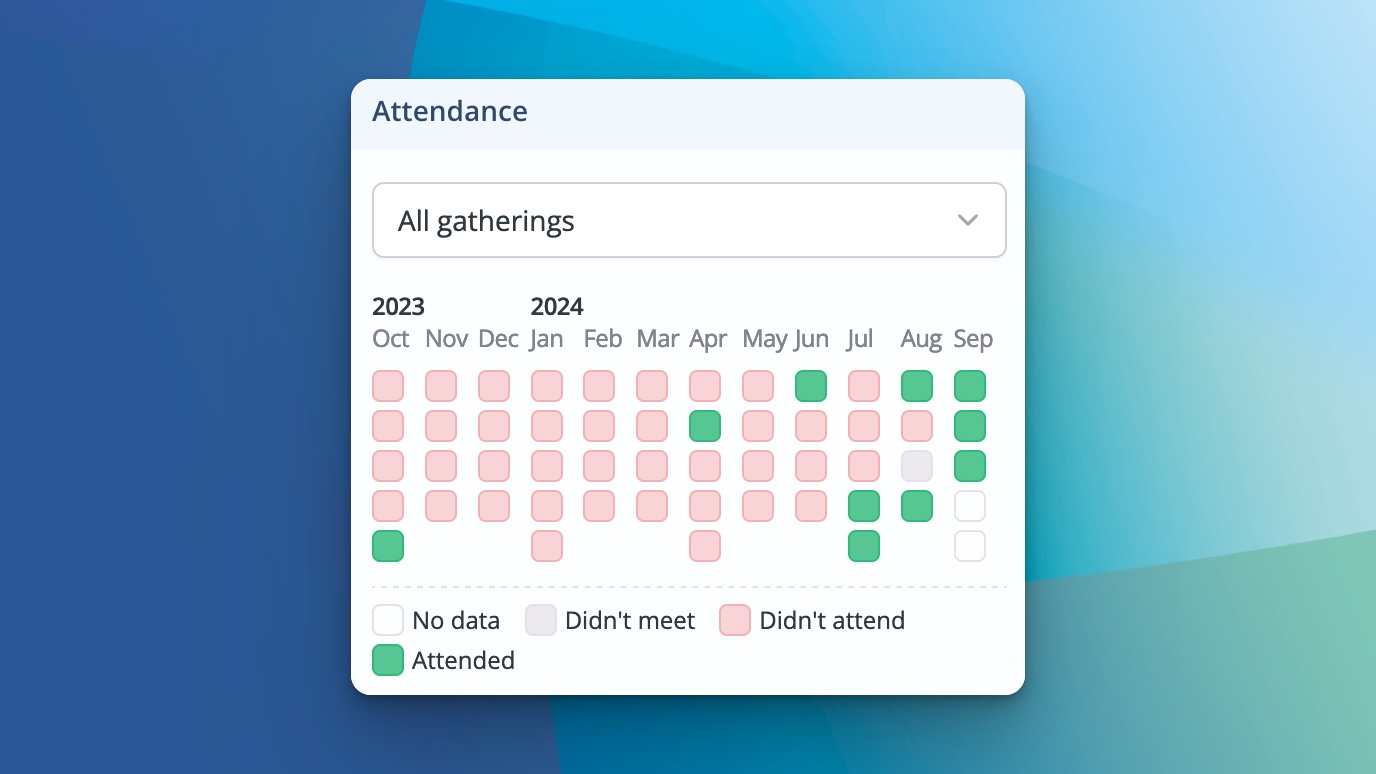
Churches who record individual attendance for pastoral care or discipleship purposes can activate "People tracking" on a per-gathering basis. If activated, you'll find a people tracking tab that displays a useful new visualisation that will help you use that data in your pastoral care processes.
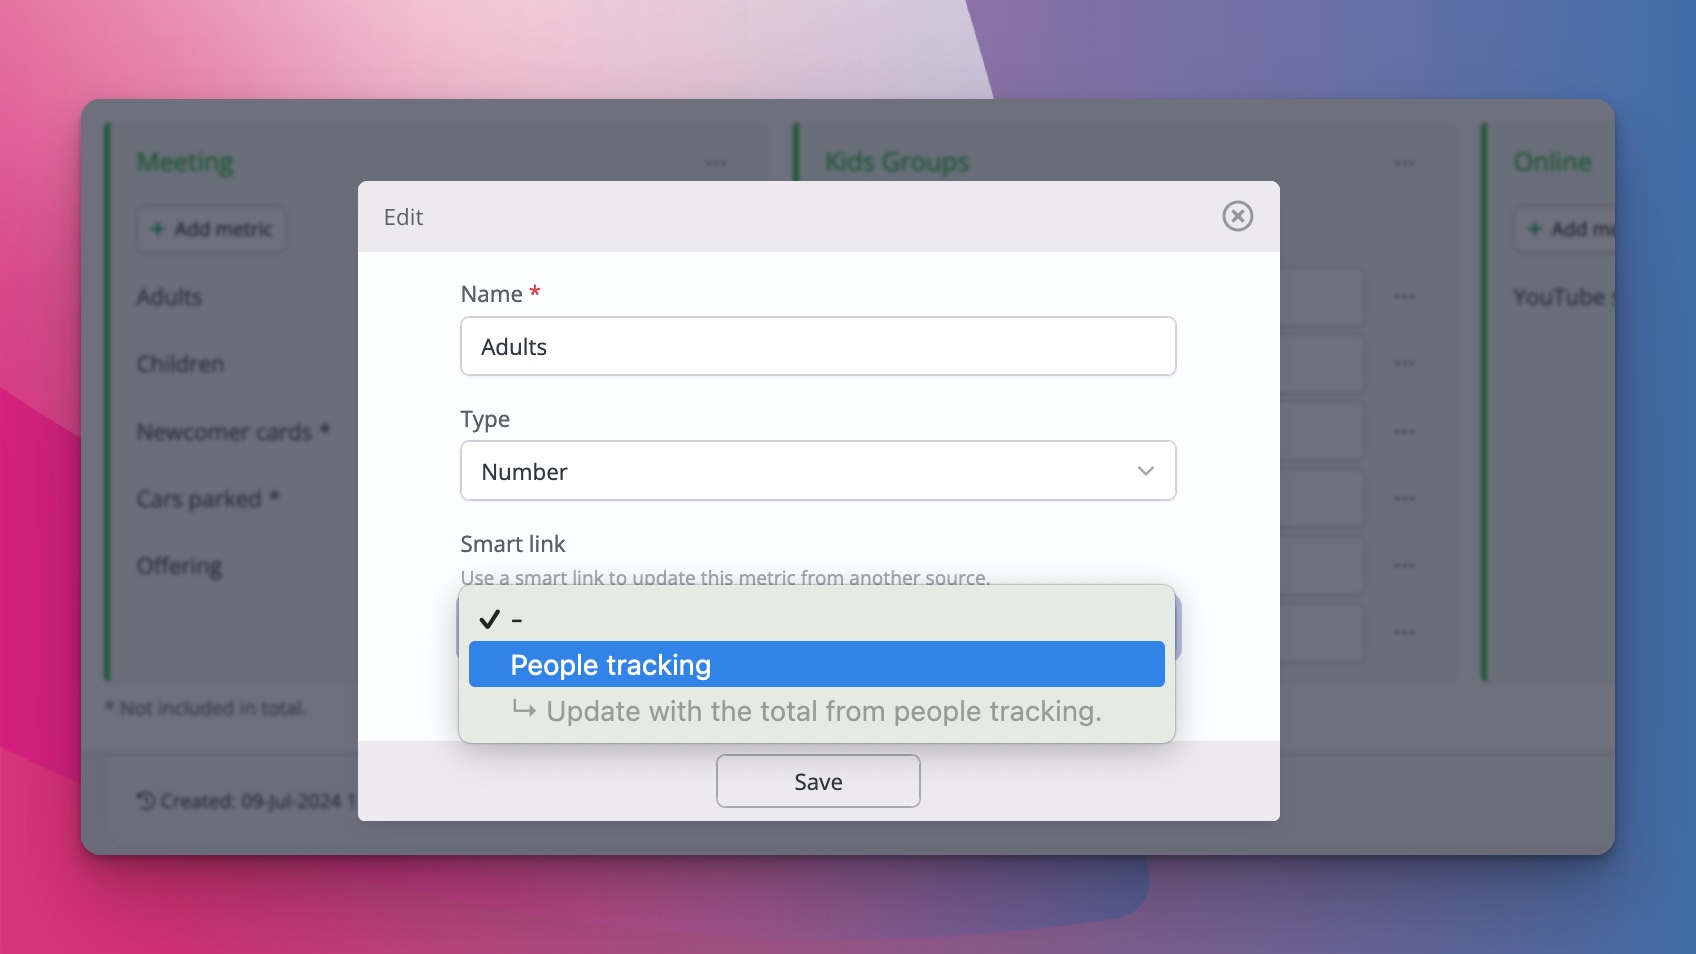
We have also added an ability to "smart link" a metric to the number of people who have been marked as having attended. This means that, as you record individuals as attending a gathering, the corresponding metric field updates automatically.
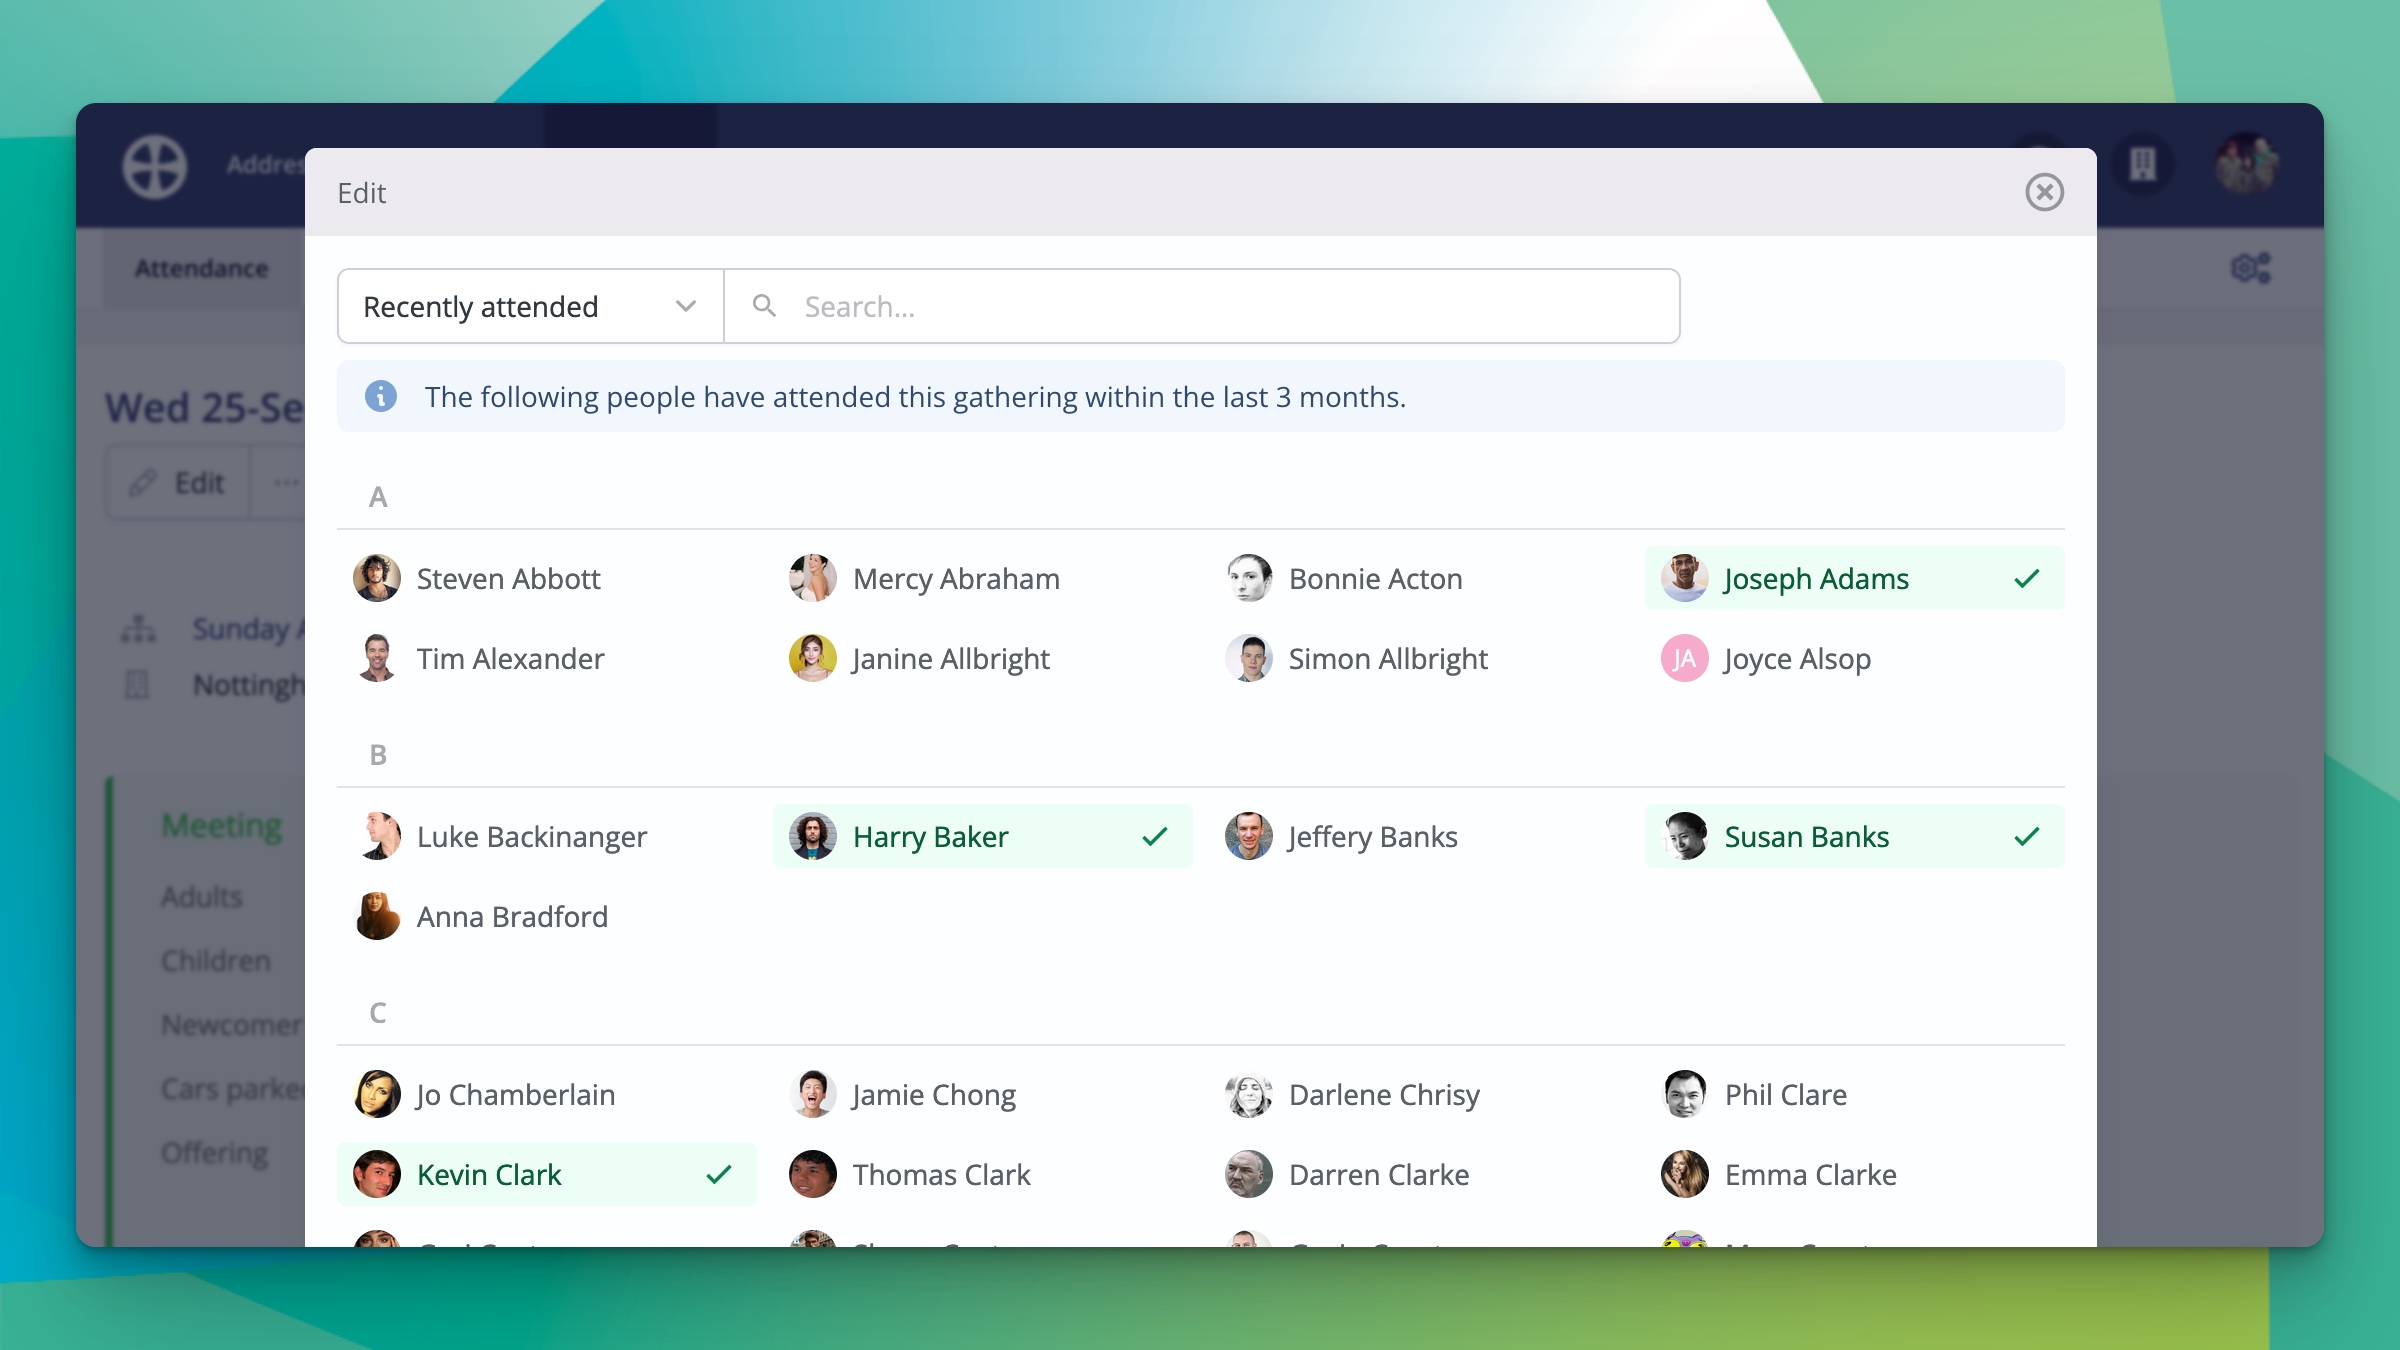
When adding an attendance record to a gathering with People Tracking enabled, we have now made it really easy to add the individual attendance data.
Finally, there's now a new People Tracking Engagement widget in the Address Book. When you click through to a contact and go to the "Engagement" tab, the people tracking widget surfaces the attendance data for that person in a convenient way.
New reports
We've completely rebuilt the reports available in the Attendance module. The graph generator allows you to compare any metric from any gathering against any metric from a different one.
What about my existing data?
All your existing data remains safely in place as part of a single "default" gathering in the Attendance module. To help you start making the most of the new features, we have made it very easy and simple for you to separate your data out into different gatherings - the best way to get started is by watching the video above, where Gavin walks you through this quick and easy process.
We believe these updates will give you lots more functionality and flexibility in the Attendance module. With the updated look, the new filtering options, and the ability to gather data for multiple gatherings on the same date, we hope you will find the Attendance module even more helpful and convenient as you gather, manage and analyse your attendance data.